Install Python with NumPy SciPy Matplotlib on macOS Big Sur (Apple Silicon arm64 version)
Posted on June 15, 2021 by Paul
In this article, I will show you how to install Python with NumPy, SciPy and Matplotlib on macOS Big Sur. I will show you how to install natively the above three libraries, using arm64 Apple Silicon versions. I assume that you have one of the M1 or newer arm64 processors. If you have an Intel based Mac, please check my other article.
MacOS Big Sur comes by default with Python 2.7 which, at this point, receives only bug fixes and is EOL since 2020. Python 3 is the future and it is supported by all major Python libraries. In this tutorial, we’ll use Python 3.9 which is the latest stable release of Python at the time of this writing.
Start by installing the Command Line Tools for macOS. Please note, that you will need the Command Line Tools even if you’ve already installed Xcode. Open a Terminal and write:
1 xcode-select --installAs a side note, after you install the Command Line Tools, you will also get a slightly older Python 3 version (3.8). At the time of this writing, neither the official version of Python from https://www.python.org/ or the Apple provided one will let you install natively NumPy, SciPy or Matplotlib using the default Python mechanism through pip.
In order to be able to install natively the above three libraries we are going to use Miniforge which is also recommended by Apple for other arm64 libraries that are not yet supported through pip.
On the Miniforge page, make sure to download the arm64 (Apple Silicon) architecture:
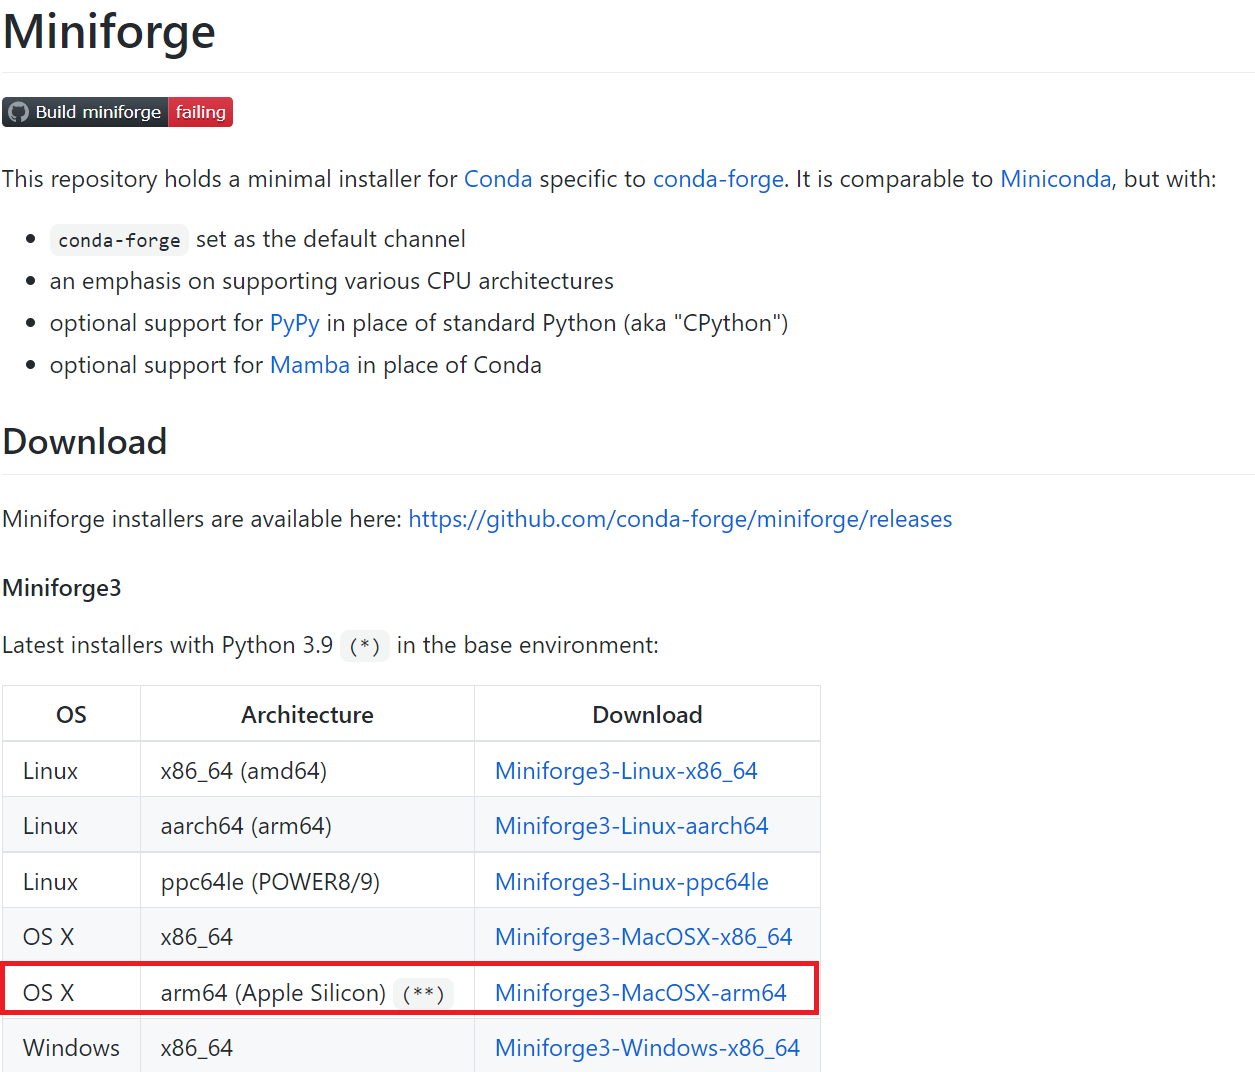
you should end up with a file named Miniforge3-MacOSX-arm64.sh in your Downloads folder.
Next, open a Terminal, navigate to your Downloads folder, make Miniforge3-MacOSX-arm64.sh executable and run the script:
1 cd Downloads
2 chmod +x Miniforge3-MacOSX-arm64.sh
3 ./Miniforge3-MacOSX-arm64.sh
You can safely accept the defaults and answer yes to all questions. Once the installation is finished activate Miniforge:
1 source ~/miniforge3/bin/activateAt this point, your prompt should indicate that you are using the base environment. If you open a new tab in Terminal or if you restart the Terminal the base environment will be activated by default.
Now, we are going to use the conda command from Miniforge to create a new environment, named work (feel free to use a different name), and activate it:
1 conda create -n work python=3.9
2 conda activate work
At this point, your prompt should indicate that you are using the work environment.
Once the work environment is activated we can install NumPy, SciPy or Matplotlib to this environment:
1 conda install numpy scipy matplotlibPlease note that if you restart your Terminal it will revert to the base environment. If you need to use the work environment or the libraries you just installed use:
1 conda activate workto activate it.
As a side note, when you are in an active environment you can use the python command to invoke the Python interpreter, no need to use the version number.
Fire up Python, import scipy and print the version of the installed library. This is what I see on my machine:
1 (work) % python
2 Python 3.9.4 | packaged by conda-forge | (default, May 10 2021, 22:10:52)
3 [Clang 11.1.0 ] on darwin
4 Type "help", "copyright", "credits" or "license" for more information.
5 >>> import scipy as sp
6 >>> sp.version.version
7 '1.6.3'
8 >>> quit()(work) %
Let’s try something a bit more interesting now, let’s plot a simple function with Matplotlib. Start the python interpreter and try the next examples.
First, we’ll import NumPy and Matplotlib with:
1 import numpy as np
2 import matplotlib.pylab as plt
Next, we can define some points on the (0, 1) interval with:
1 t = np.linspace(0, 1, 100)Now, let’s plot a parabola defined on the above interval:
1 plt.plot(t, t**2)
2 plt.show()
You should see something like this:
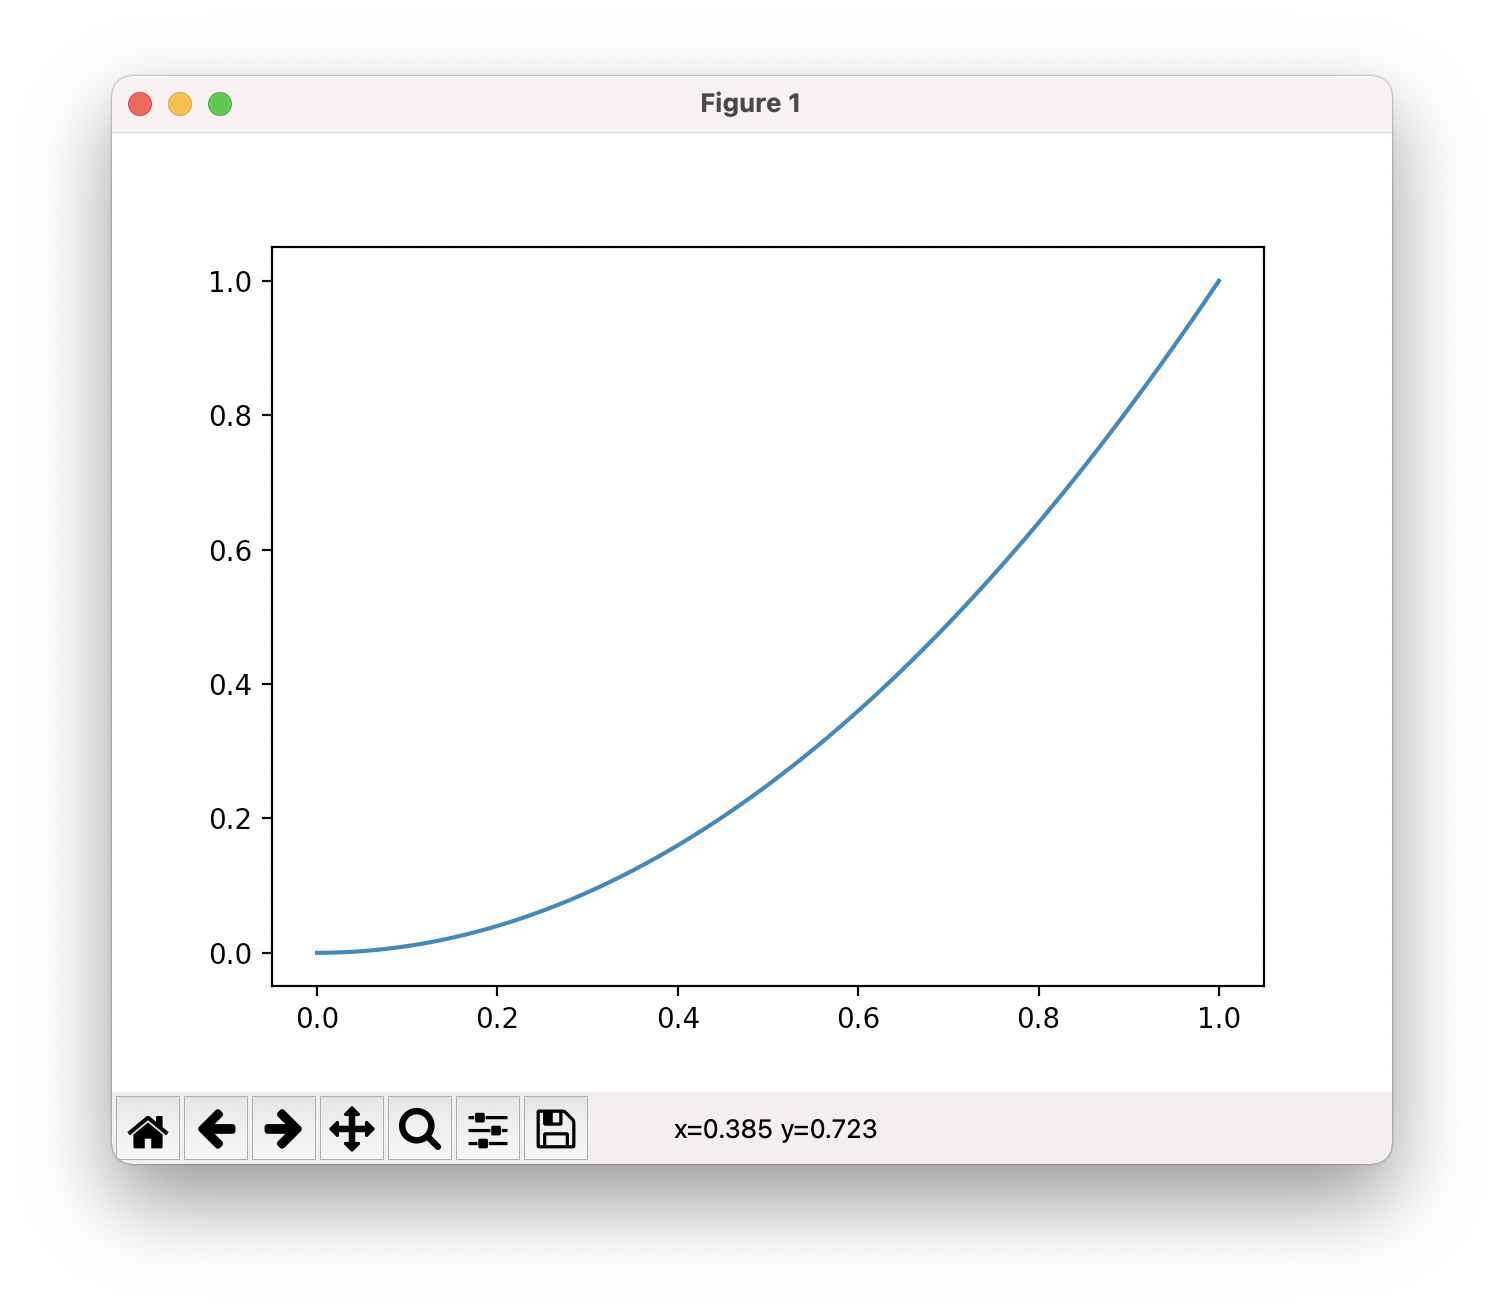
As you’ve probably noticed, plt.show() is a blocking command. You won’t be able to use the interpreter until you close Figure 1.
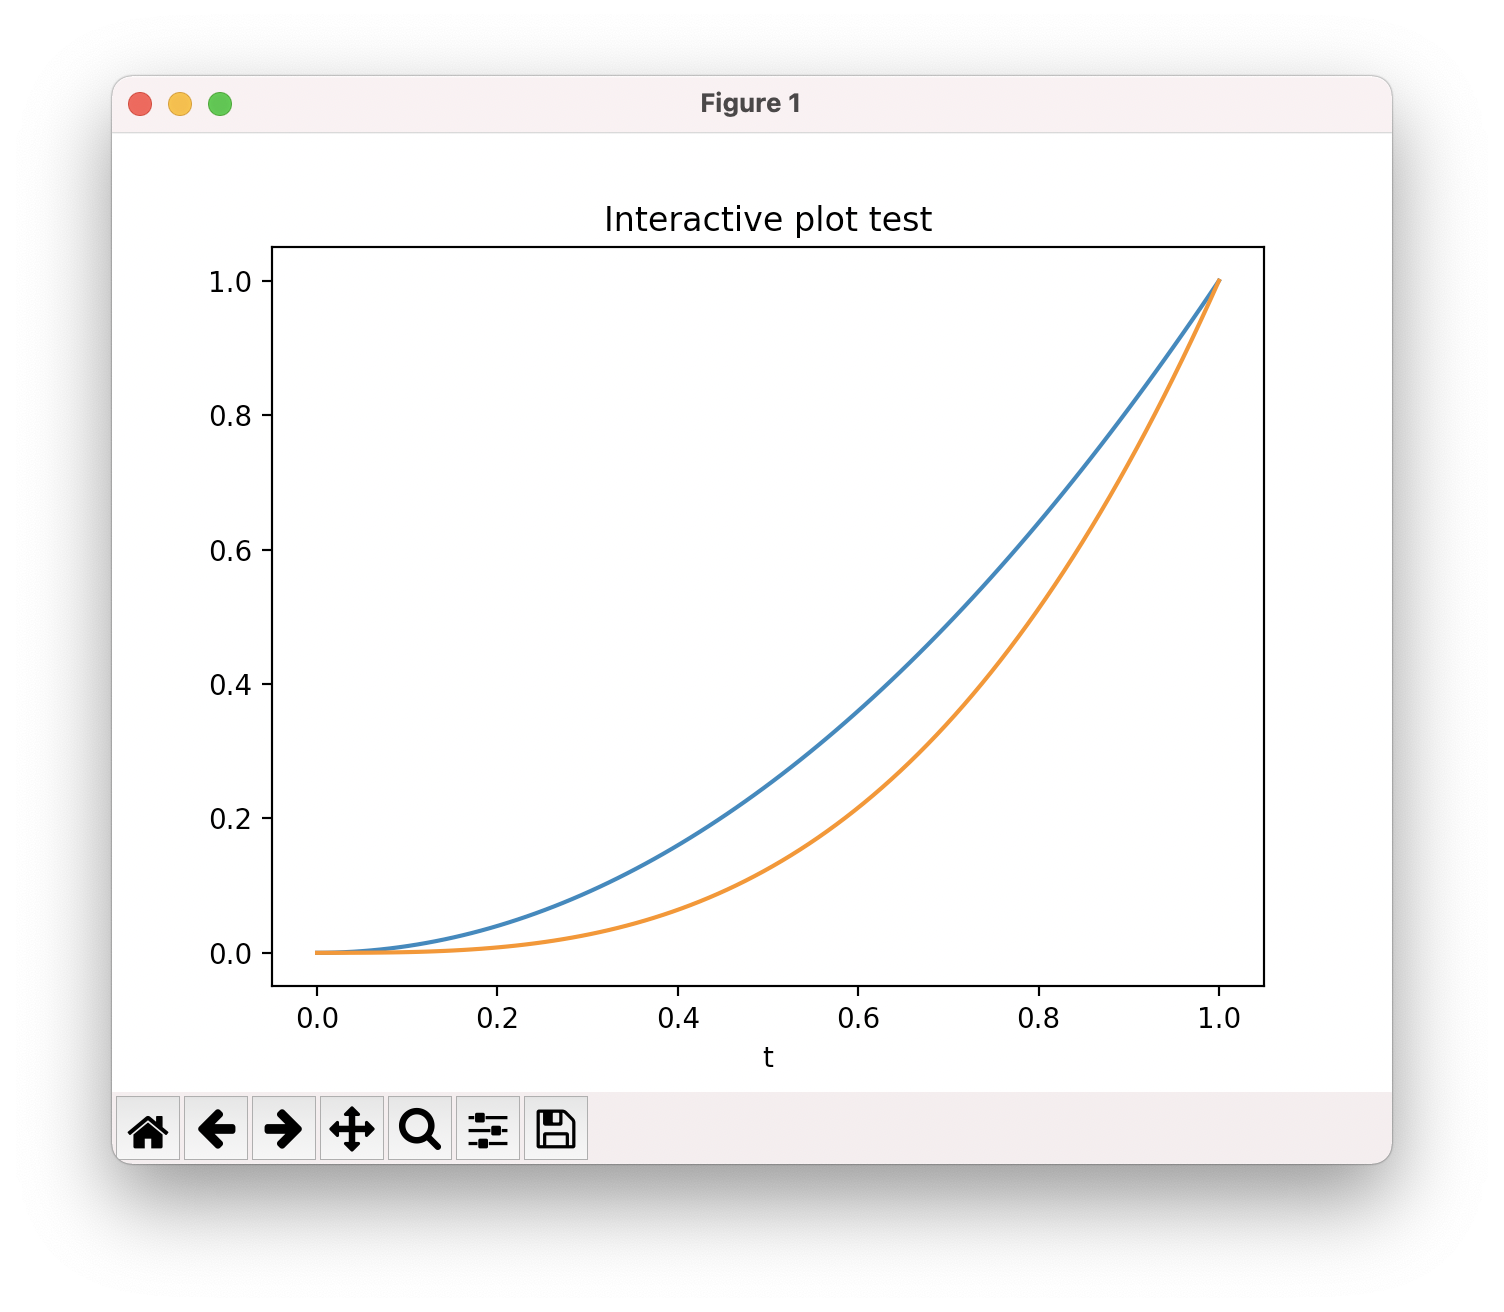
There is also an interactive mode in which you can plot functions. Close Figure 1 and write:
1 plt.ion()
2 plt.plot(t, t**2)
3 plt.title("Interactive plot test")
4 plt.plot(t, t**3)
5 plt.xlabel("t")
This is what you should see:
At any point you can disable the interactive plot mode with:
1 plt.ioff()after which you will need to use the plt.show() function in order to actually see the result of the plt.plot function.