Getting started with C++ MathGL on Windows and Linux
Posted on June 25, 2020 by Paul
In this article, I will show you how to install and get started with the C++ interface of MathGL on Linux and Windows. MathGL is a high quality scientific graphics library.
In the first two parts of the article I will describe how to install the library and how to build a C++ MathGL example. In the third part of the article we’ll use MathGL to create a 2D function graphic and save it as an image file. As a second example, we’ll use the FLTK GUI library to show the same 2D function:
This article is split in three parts:
I recommend that you read the install part for your OS and the part that shows how to use MathGL to create some graphics.
On Windows, the recommended approach to install MathGL is to use the official MathGL binaries. From the above page, download the GPL or LGPL binaries for MinGW 64 bits. After you’ve finished downloading the archive, you can extract it with 7zip.
Next, we are going to install the MinGW 64 GCC toolchain that was used to build the library. At the current time, easiest approach is to download Code::Blocks version 20.03. Make sure to download the file named codeblocks-20.03mingw-setup.exe.
Start the Code::Blocks installer and accept the defaults. Once the installation is finished, Code::Blocks will detect the included GCC toolchain.
Next, you will need to manually copy the content of the MathGL archive to the location where Code::Blocks has installed GCC, this is usually C:\Program Files\CodeBlocks\MinGW.
Copy the content of the bin folder of MathGL to the the bin folder of MinGW. When asked if you want to overwrite some files with the same names, skip these files.
Copy the content of the lib folder of MathGL to the the lib folder of MinGW.
Open the include folder of MathGL and copy the include folder mgl2. Inside the MinGW folder, go to x86_64-w64-mingw32, open the include folder and paste the mgl2 folder in here.
Open Code::Blocks and create a new project, chose Console Application and C++. Chose a name for the project and a location.
Once the C++ console project is open, right click on the project name (in the left panel) and select Build options. Select Linker Settings and in the Other linker options panel add the desired libraries: -lmgl in this case. If you want to be able to use the FLTK GUI library, like you will see in our second example, you will need to add -lmgl -lmgl-fltk. Press OK.
In Code::Blocks, you can use the Build and Run button (the small wheel with a green triangle icon) to compile and execute a program.
Next, remove the default C++ generated code from main.cpp and go to MathGL usage part of this article for an example.
For Linux, I will exemplify the installation part on a Debian based system.
Let’s start by installing a C++ toolchain. Open a Terminal and write:
1 sudo apt install build-essentialNext, install MathGL with:
1 sudo apt install libmgl-devAssuming that you’ve saved your MathGL program in a file named mgl_ex1.cpp, this is how you can build it:
1 g++ mgl_ex1.cpp -o mgl_ex1 -lmglor, if you are using the FLTK GUI library:
1 g++ mgl_ex1.cpp -o mgl_ex1 -lmgl -lmgl-fltkOnce the program is compiled, you can run it as usual on Linux with:
1 ./mgl_ex1Next, go to the MathGL usage part of this article for an example program.
Here is a small C++ MathGL program that will draw a wave curve and save the graphic in an image file named mgl_example.png:
 1 #include <mgl2\mgl.h>
 2
 3 int main() {
 4     mglGraph gr;
 5     gr.Title("MathGL Demo");
 6     gr.SetOrigin(0, 0);
 7     gr.SetRanges(0, 10, -2.5, 2.5);
 8     gr.FPlot("sin(1.7*2*pi*x) + sin(1.9*2*pi*x)", "r-2");
 9     gr.Axis();
10     gr.Grid();
11     gr.WriteFrame("mgl_example.png");
12 }
The image will be saved where your program executable is located.
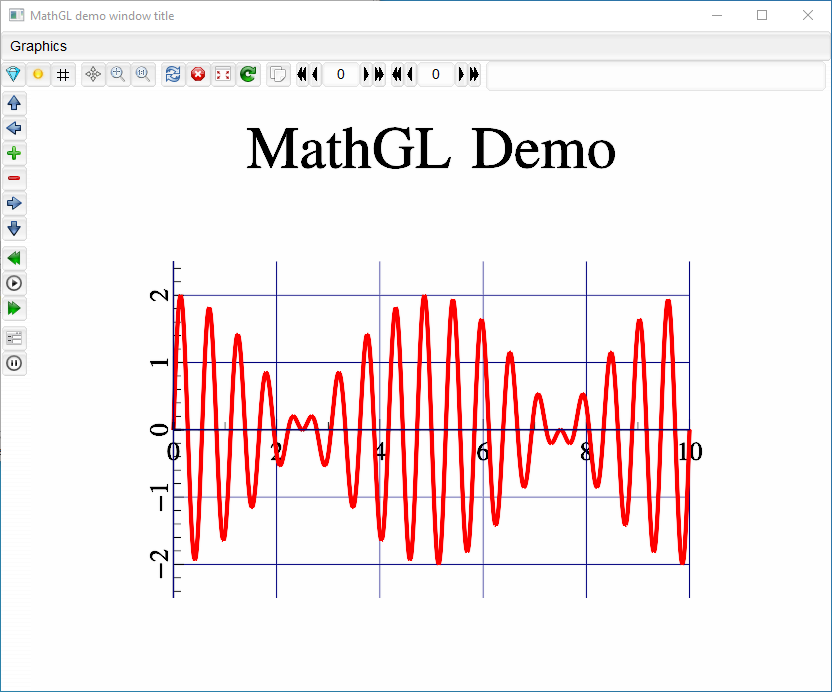
Next, we’ll draw the same curve, but this time using a FLTK window that will let you play with the graph: zoom, pan, rotate and other operations:
 1 #include <mgl2/fltk.h>
 2
 3 int graph(mglGraph *gr) {
 4     gr->Title("MathGL Demo");
 5     gr->SetOrigin(0, 0);
 6     gr->SetRanges(0, 10, -2.5, 2.5);
 7     gr->FPlot("sin(1.7*2*pi*x) + sin(1.9*2*pi*x)", "r-4");
 8     gr->Axis();
 9     gr->Grid();
10     return 0;
11 }
12
13 int main() {
14     mglFLTK gr(graph, "MathGL demo window title");
15     return gr.Run();
16 }
If you want to learn more about the capabilities of MathGL I recommend that you check their examples and the user manual.