Getting Started with Clang and Visual Studio Code on Windows with MSYS2 and MinGW-w64
Posted on June 11, 2021 by Paul
This is a short introduction in getting started with Clang on Windows 10 under MSYS2 and MinGW-w64. The Clang and LLVM binaries from https://llvm.org/ require that you to have Visual Studio 2019 installed on your machine, MSYS2 is a lighter alternative. In the last part of this article, I will show you how to use VS Code to build and debug a simple C++ program.
This article is split into three parts:
- Install MSYS2, Clang and GDB
- Compile and debug a simple C++ program from the MSYS2 terminal
- Compile and debug a simple C++ program from VS Code
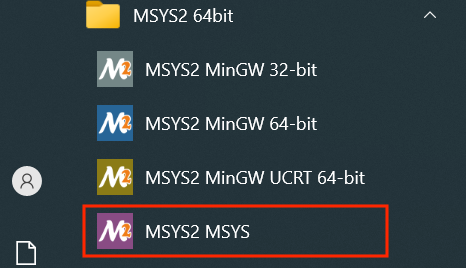
Start by installing MSYS2 from https://www.msys2.org/, the installer will guide you through the required steps. Once the installation is finished, start an MSYS2 MSYS terminal from the Windows start menu:
Update the system with:
1 pacman -Syuand accept the updates by writing Y.
Repeat the above command one more time to be sure that the system is fully updated.
Next, we are going to install Clang and GDB:
1 pacman -S --needed base-devel mingw-w64-ucrt-x86_64-clang mingw-w64-ucrt-x86_64-gdbwrite Y when asked if you agree to install the required dependencies.
At this point, we are done with the installation. Close the MSYS2 MSYS terminal by writing:
1 exitCompile and debug a simple C++ program from the MSYS2 terminal:
From the Windows start menu find MSYS2 MinGW UCRT 64-bit and start a new terminal:
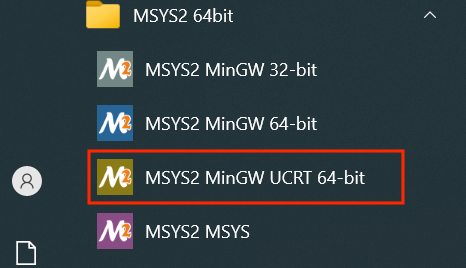
Alternatively, you can open the same terminal from the disk C → msys64 → ucrt64.exe.
Check the version of the installed Clang with:
1 clang --versionThis is what I see on my machine:
1 $ clang --version
2 clang version 12.0.0
3 Target: x86_64-w64-windows-gnu
4 Thread model: posix
5 InstalledDir: C:/msys64/ucrt64/bin
Create a folder named cpp_test and inside, a new file named test.cpp with this content:
 1 #include <iostream>
 2 #include <vector>
 3
 4 int main() {
 5     std::cout << "Hello, World\n";
 6
 7     std::vector<int> V{1, 2, 3, 4, 5};
 8     int a = 8;
 9
10     for(auto &e : V) {
11         std::cout << e << ' ';
12     }
13     std::cout << '\n';
14
15     std::cout << "a = " << a << '\n';
16 }
You can build the program with:
1 clang++ -std=c++20 -Wall -Wextra -pedantic -g test.cpp -o test.exeThis is what I see on my machine if I build and run the above program:
 1 UCRT64 ~/cpp_test
 2 $ clang++ -std=c++20 -Wall -Wextra -pedantic -g test.cpp -o test.exe
 3
 4 UCRT64 ~/cpp_test
 5 $ ./test
 6 Hello, World
 7 1 2 3 4 5
 8 a = 8
 9
10 UCRT64 ~/cpp_test
11 $
If you want to debug the code directly with GDB try this:
1 gdb test.exeAdd a break point to the start of main with:
1 b mainRun the program to the previously added breakpoint with:
1 rAdvance three lines with:
1 n 3You can visualize the content of the variable a with:
1 p aOr, if you want to see the content of the vector V:
1 p VIf you want to run to the end of the program write:
1 cand exit from the debugger with:
1 qThis is what I see on my machine if I run the above commands:
 1 UCRT64 ~/cpp_test
 2 $ gdb test.exe
 3 GNU gdb (GDB) 10.2
 4 Copyright (C) 2021 Free Software Foundation, Inc.
 5 License GPLv3+: GNU GPL version 3 or later <http://gnu.org/licenses/gpl.html>
 6 This is free software: you are free to change and redistribute it.
 7 There is NO WARRANTY, to the extent permitted by law.
 8 Type "show copying" and "show warranty" for details.
 9 This GDB was configured as "x86_64-w64-mingw32".
10 Type "show configuration" for configuration details.
11 For bug reporting instructions, please see:
12 <https://www.gnu.org/software/gdb/bugs/>.
13 Find the GDB manual and other documentation resources online at:
14     <http://www.gnu.org/software/gdb/documentation/>.
15
16 For help, type "help".
17 Type "apropos word" to search for commands related to "word"...
18 Reading symbols from test.exe...
19 (gdb) b main
20 Breakpoint 1 at 0x1400015ac: file test.cpp, line 5.
21 (gdb) r
22 Starting program: C:\msys64\home\X\cpp_test\test.exe
23 [New Thread 5188.0x1aa8]
24 [New Thread 5188.0x114c]
25 [New Thread 5188.0x5b8]
26
27 Thread 1 hit Breakpoint 1, main () at test.cpp:5
28 5               std::cout << "Hello, World\n";
29 (gdb) n 3
30 10              for(auto &e : V) {
31 (gdb) p a
32 $1 = 8
33 (gdb) p V
34 $2 = std::vector of length 5, capacity 5 = {1, 2, 3, 4, 5}
35 (gdb) c
36 Continuing.
37 Hello, World
38 1 2 3 4 5
39 a = 8
40 [Thread 5188.0x114c exited with code 0]
41 [Thread 5188.0x5b8 exited with code 0]
42 [Thread 5188.0x1aa8 exited with code 0]
43 [Inferior 1 (process 5188) exited normally]
44 (gdb) q
45
46 UCRT64 ~/cpp_test
47 $
Compile and debug a simple C++ program from VS Code:
In the last part of the article, I will show you how to build and debug the above simple C++ program from VS Code. Download VS Code and install it on your machine. You can accept the default options.
Next, make sure you have a MSYS2 MinGW UCRT 64-bit terminal open, see the previous section.
We are going to add VS Code to the MSYS2 path. This is important because it will let VS Code know about the compiler and debugger that are available from MSYS2. Without this step, VS Code will not know from were to get your compiler and debugger.
Open the file .bashrc from the Home folder, here is an example of doing that using the nano text editor:
1 cd ~
2 nano .bashrc
Scroll to the end of the file and write or paste the next line:
1 export PATH=$PATH:/C/Users/$USERNAME/AppData/Local/Programs/Microsoft\ VS\ Code/binSave the file by pressing CTRL+O, exit from nano by pressing CTRL+X.
Next, write this in the terminal to enable the above modification:
1 source .bashrcNavigate to the folder where you saved the C++ program in the previous section and erase the existing executable:
1 cd cpp_test
2 rm test.exe
Start VS Code in this folder with:
1 code .From the VS Code left panel, select the file test.cpp. If prompted to install the C/C++ extension accept it, otherwise press on the extensions button from VS Code and search for C++. You want to install C/C++ from Microsoft.
Once the extension is installed, press on the Run and Debug button. Press again on Run and Debug. Select C++(GDB/LLDB) when presented with a list of environments, next select g++.exe - Build and debug active file. This will create a new folder named .vscode in your project folder.
Select the Explorer button from VS Code to see the files that are in cpp_test. Click on .vscode, you should see two files in there launch.json and tasks.json.
Open tasks.json and find the command property:
1 "command": "C:\\msys64\\ucrt64\\bin\\g++.exe",Change g++.exe to clang.exe. It should look like this:
1 "command": "C:\\msys64\\ucrt64\\bin\\clang++.exe",Next, find the args array
1             "args": [
2                 "-g",
3                 "${file}",
4                 "-o",
5                 "${fileDirname}\\${fileBasenameNoExtension}.exe"
6             ],
Add a few extra options:
1             "args": [
2                 "-std=c++20",
3                 "-Wall",
4                 "-Wextra",
5                 "-g",
6                 "${file}",
7                 "-o",
8                 "${fileDirname}\\${fileBasenameNoExtension}.exe"
9             ],
This is the full content of my tasks.json:
1 {
2 "tasks": [
3 {
4 "type": "cppbuild",
5 "label": "C/C++: g++.exe build active file",
6 "command": "C:\\msys64\\ucrt64\\bin\\clang++.exe",
7 "args": [
8 "-std=c++20",
9 "-Wall",
10 "-Wextra",
11 "-g",
12 "${file}",
13 "-o",
14 "${fileDirname}\\${fileBasenameNoExtension}.exe"
15 ],
16 "options": {
17 "cwd": "${fileDirname}"
18 },
19 "problemMatcher": [
20 "$gcc"
21 ],
22 "group": {
23 "kind": "build",
24 "isDefault": true
25 },
26 "detail": "Task generated by Debugger."
27 }
28 ],
29 "version": "2.0.0"
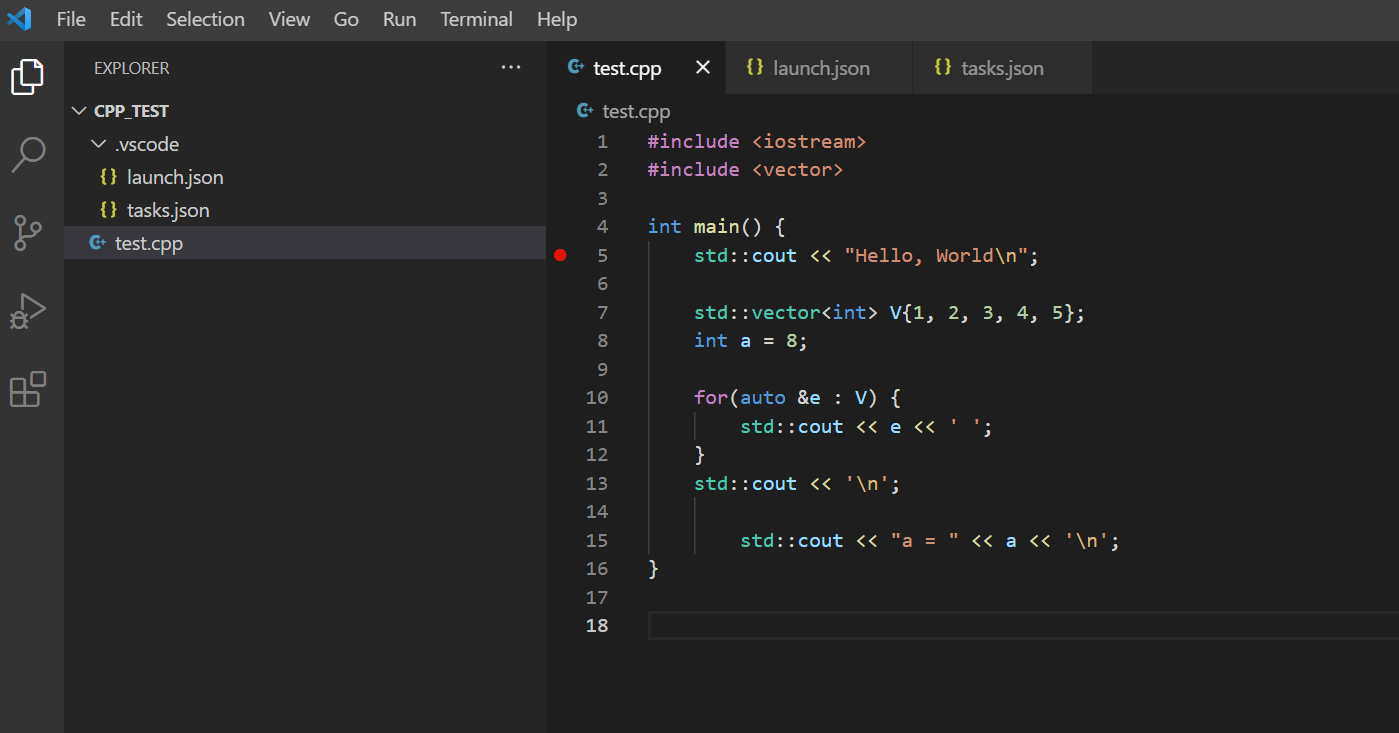
30 }Next, click on the first line of the main function to add a breakpoint (left of the line numbers). You should see a red dot:
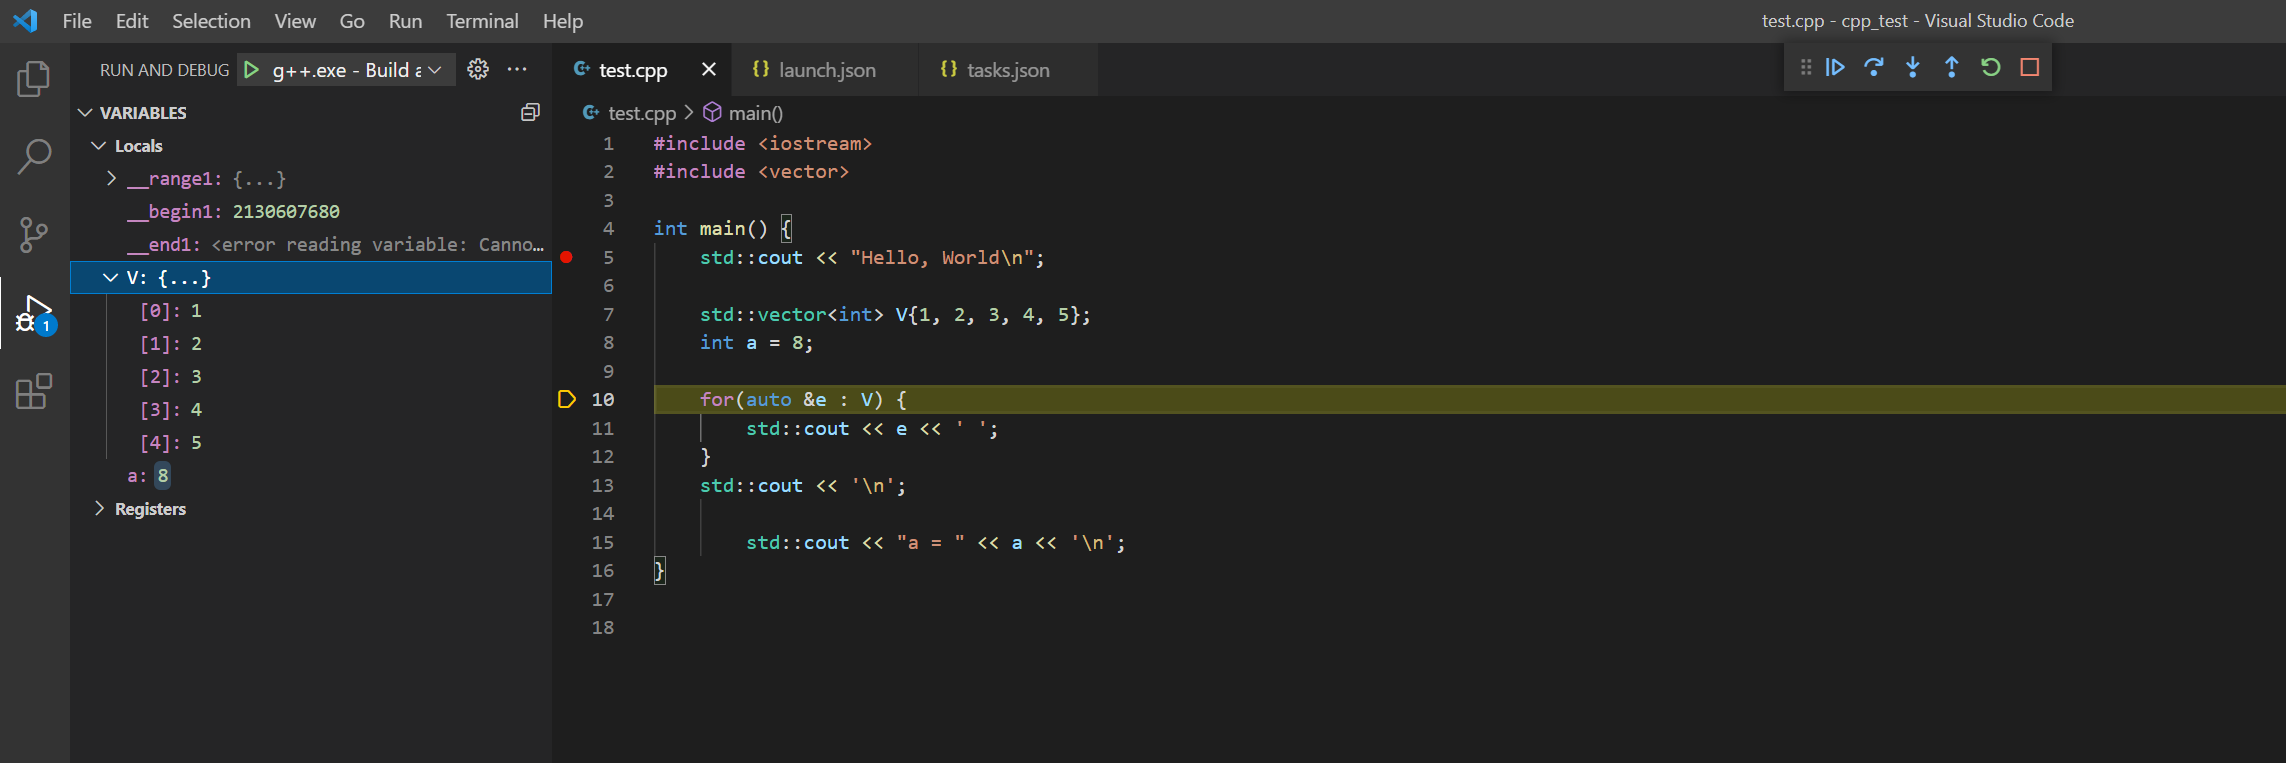
Press the Run and Debug again. VS Code should compile your program, run and stop at the breakpoint. In the left panel you can see the local variables of the current function which are not initialized at this point. Step three times by pressing the curve arrow from the top middle of VS Code.
Now, you can see the content of the vector V, if you click on it.
This is what I see on my machine:
If you want to continue the program, you can press the left triangle from the above middle panel.
If you want to learn more about VS Code check the documentation or leave me a comment with a specific question.