Scientific graphics in C#
Posted on October 6, 2011 by Paul
The code for this tutorial is on GitHub: https://github.com/sol-prog/GraphDemo1
Imagine for a moment that you are stranded on a deserted island only with your laptop, your task is to write a compiled application that will let the user load a file with numbers and plot these on a graphic. For the sake of argument let's suppose you have a Windows based computer and, because Windows does not include any compiler by default, we'll also suppose you have Visual Studio 2010 installed. What would you do ?
Last week I was in a similar situation when my internet connection was down for two days and I was pressed by a client to add some 2D graphical capability to a C# application, the deadline for this project was quickly arriving and no third party library was allowed, only what is included by default with VS 2010. My solution was to use the Chart control for plotting the data on a Windows Form. The by-product of this project was this post in which I will show you how to add to a C# application a plotting area that will allow you to plot and save the graphics as high quality images.
This tutorial is intended to be self sustained even for a beginner so I will exemplify each step of building this app with screenshots. If you are an advanced C# coder feel free to skip the boilerplate sections. Next figure is an example of what kind of graphics you can create with the app we are going to build:
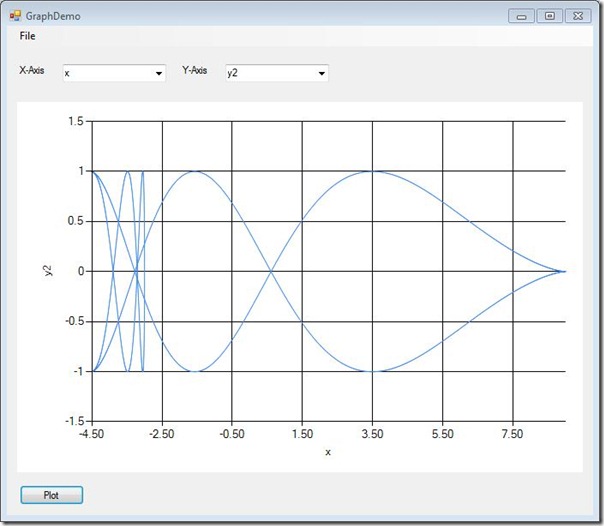
In case you are wondering, this is the formula I've used for generating the data for the upper picture:
$$ x(t) = 2 \cdot a \cdot \cos (t) + a \cdot \cos (2 \cdot t) $$ $$ y(t) = \sin ( 2 \cdot a \cdot \sin (t) - a \cdot \sin (2 \cdot t)) $$
where:
$$ t \in 0...2 \cdot \pi $$
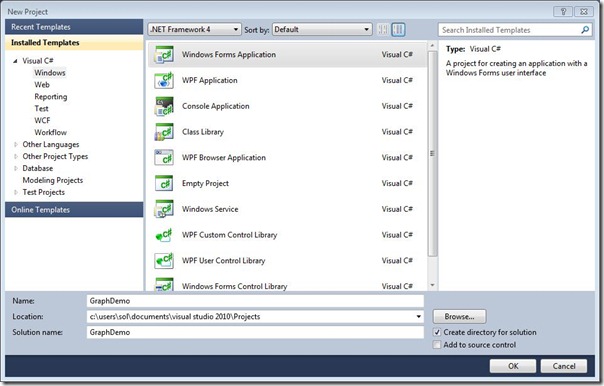
Open VS 2010 and create a new C# project: File->New Project, select Windows Forms Application and give a meaningful name to your app (GraphDemo in my case):
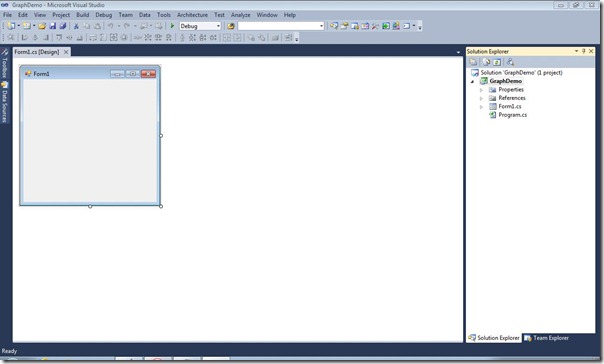
Press OK. You should end up with a fresh Windows Form in your Design panel:
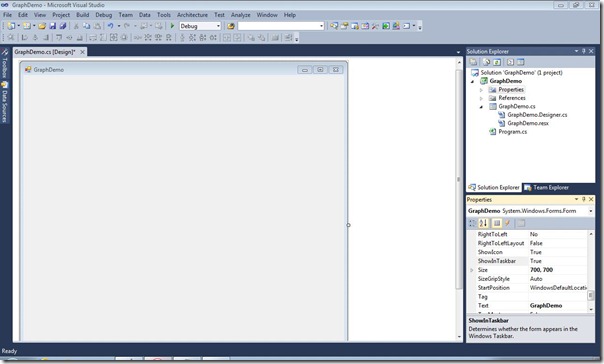
From Solution Explorer right click Form1.cs and chose Rename, we will name this GraphDemo.cs. Press Yes when VS will ask if you want to rename this in all references.
Right click on the Form and select Properties, this will open a new Properties panel at right, change the value for Text from "Form1" to GraphDemo. You should see the new name on the Form. Change the Size property of the Form from 300,300 to 700,700 (of course you can achieve a similar result by dragging the lower right corner of the Form).
From the left upper corner select Toolbox and drag a MenuStrip on the Form, write File in the small text box, also add free submenus to File: Open, Save and Exit:
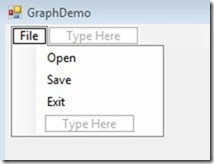
As you can guess by now, our application will allow the user to open a data file, plot the data and save the resulting image.
Let's add some code to the above submenus, double click on Exit, this will create for you an empty function that will be called when the user presses Exit:
1 private void exitToolStripMenuItem_Click(object sender, EventArgs e)
2 {
3 	Application.Exit();
4 }
Try if you have any error in the above code by compiling and running the application: press F5 or go to Debug->Start Debugging. If you haven't made any error you should see the app running. Try to close the app using the Exit submenu!
Next, we will implement the Open functionality. In order to keep the code simple we will assume that the user will only load csv files (comma separated values), e.g.:
1 x,y1,y2,y3
2 0,0,0.13,1
3 0.25,0.5,-0.22,2
4 0.5,1,0.8,3
5 1,2,0.7,4
Double click on GraphDemo[Design] at File->Open this, like before, will create an empty function for you, let's add the code that will let us load a csv file:
 1 private void openToolStripMenuItem_Click(object sender, EventArgs e)
 2 {
 3 	Stream myStream = null;
 4 	OpenFileDialog ff = new OpenFileDialog();
 5
 6 	ff.InitialDirectory = "c:\\";
 7 	ff.Filter = "csv files (*.csv)|*.csv|All files (*.*)|*.*";
 8 	ff.FilterIndex = 1;
 9 	ff.RestoreDirectory = true;
10
11 	if (ff.ShowDialog() == DialogResult.OK)
12 	{
13 		try
14 		{
15 			if ((myStream = ff.OpenFile()) != null)
16 			{
17 				using (myStream)
18 				{
19 					// Add the code to load the csv file
20 					// ...
21 					// Close the stream
22 					myStream.Close();
23 				}
24 			}
25 		}
26 		catch (Exception err)
27 		{
28 			//Inform the user if we can't read the file
29 			MessageBox.Show(err.Message);
30 		}
31 	}
32 }
If you will copy the above code in GraphDemo.cs you will see that Stream is marked in red, this is because we didn't included System.IO in our code, we can let Visual Studio to solve this for us: right click on Stream select Resolve->using System.IO. The above function will only let us use the Open submenu to select a csv file from our computer, we still need to add the code that will actually read the file.
For actually reading a csv file from the disk we will create a new C# class. In Solution Explorer right click on GraphDemo and select Add->New Item select Class and change the default name of this into something more meaningful say "Read.cs" press Add and you will end up with an empty class:
 1 using System;
 2 using System.Collections.Generic;
 3 using System.Linq;
 4 using System.Text;
 5
 6 namespace GraphDemo
 7 {
 8     class Read
 9     {
10     }
11 }
We will add code for parsing a csv file and for storing and retrieving the header and the data. Let's start by creating a few private variables used for storing the data and the functions used for getting this data:
 1 ...
 2 namespace GraphDemo
 3 {
 4     class Read
 5     {
 6         private string[] header;
 7         private float[,] data;
 8         private int nLines;
 9         private int nColumns;
10
11         //constructor to be implemented
12         public Read()
13         {
14         }
15
16         //functions used for retrieving the data
17         public int get_nLines()
18         {
19             return nLines;
20         }
21
22         public int get_nColumns()
23         {
24             return nColumns;
25         }
26
27         public float[,] get_Data()
28         {
29             return data;
30         }
31
32         public string[] get_Header()
33         {
34             return header;
35         }
36     }
37 }
Next, we implement the Read constructor:
 1 ...
 2 public Read(Stream myStream)
 3 {
 4 	string aux;
 5 	string[] pieces;
 6
 7 	//read the file line by line
 8 	StreamReader sr = new StreamReader(myStream);
 9 	aux = sr.ReadLine();
10 	header = aux.Split(',');
11 	nColumns = header.Length;
12 	nLines = 0;
13 	while ((aux = sr.ReadLine()) != null)
14 	{
15 		if (aux.Length > 0) nLines++;
16 	}
17
18 	//read the numerical data from file in an array
19 	data = new float[nLines, nColumns];
20 	sr.BaseStream.Seek(0, 0);
21 	sr.ReadLine();
22 	for (int i = 0; i < nLines; i++)
23 	{
24 		aux = sr.ReadLine();
25 		pieces = aux.Split(',');
26 		for (int j = 0; j < nColumns; j++) data[i, j] = float.Parse(pieces[j]);
27 	}
28 	sr.Close();
29 }
30 ...
Like before StreamReder will be underlined in red, right click and chose Resolve ...
We are ready to use the Read class, open GraphDemo.cs and add these lines of code in the function openToolStripMenuItem_Click:
1 ...
2 using (myStream)
3 {
4 	rr = null;
5 	rr = new Read(myStream);
6 	// Close the stream
7 	myStream.Close();
8 }
9 ...
In the above code we have used an undefined variable rr, which is a Read object. Scroll at the beginning of GraphDemo.cs and add "Read rr;" just before the GraphDemo constructor, this is how the code should look:
1 namespace GraphDemo
2 {
3 public partial class GraphDemo : Form
4 {
5 Read rr;
6
7 public GraphDemo()
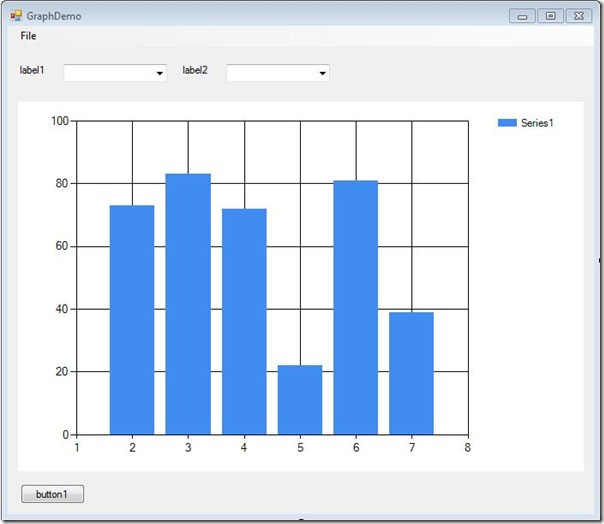
8 ...Move to the Design panel from Toolbox and add on the Windows Form two Labels, two ComboBoxes, one Chart element and one Button. This is a possible arrangement for the GUI (feel free to move the elements as you see fit):
Click on label1 and in the Solution Explorer->Properties modify the Text filed, which is currently "label1", to X-Axis. Apply the same procedure for label2, change the Text to Y-Axis.
Click on the left ComboBox and change his Name property to xBox, also change the Name property of the second ComboBox to yBox. Do not change the Text property for the ComboBoxes! Change the Name property of the Chart to "chart" and the Name of the Button to btnPlot. For btnPlot change the Text property from "button1" to "Plot".
Let's check if we have any error, press F5 or Debug->Start Debugging, your running app should look similar with the next figure:
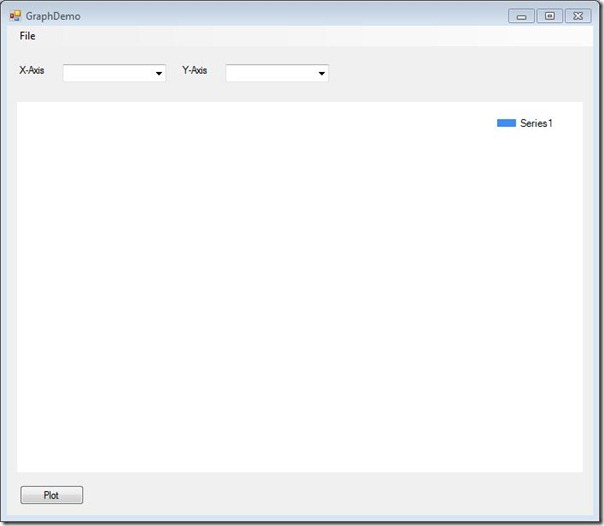
If it works than it is OK :D, you can close the application, we have work to do.
We'll start by populating the two ComboBoxes using the header of the input csv file. This will allow us to pick what variable to assign to the X-axis and Y-axis, the user should have the liberty to chose what variables he wants.
At a later stage of this tutorial I will show you how to plot multiple graphics on the same chart, for now we will keep this simple - pressing the Plot button will plot only the variables selected in the ComboBoxes. We could do this in the Open function after that file is loaded or in the Read class; for simplicity I will populate the ComboBoxes in GraphDemo.cs in the openToolStripMenuItem_Click function:
 1 ...
 2 rr = new Read(myStream);
 3 string[] header = rr.get_Header();
 4 List<string> lX = new List<string>();
 5 List<string> lY = new List<string>();
 6 for (int i = 0; i < header.Length; i++)
 7 {
 8 	lX.Add(header[i]); lY.Add(header[i]);
 9 }
10 //Populate the ComboBoxes
11 xBox.DataSource = lX;
12 yBox.DataSource = lY;
13 // Close the stream
14 myStream.Close();
15 ...
Now it is a good time to run the code and actually load a csv file, you should be able to see the ComboBoxes populated with the names of the data columns stored in the input file.
We will create a new class file named "Plot.cs" using the same workflow as before (see the Read class). This class will do the actual drawing on the chart so we'll need to grant access to the Chart element, the two ComboBoxes and the Read object:
 1 using System;
 2 using System.Collections.Generic;
 3 using System.Linq;
 4 using System.Text;
 5 using System.Windows.Forms;
 6 using System.Windows.Forms.DataVisualization.Charting;
 7 using System.Drawing;
 8
 9 namespace GraphDemo
10 {
11     class Plot
12     {
13         public Plot(Read rr, ComboBox xBox,ComboBox yBox,Chart chart)
14         {
15             // Code for drawing on the Chart
16         }
17     }
18 }
From the Design panel double click on the Plot button, this will create for you an empty function that will be called each time you press Plot. In this new function we will create a Plot object:
 1 private void btnPlot_Click(object sender, EventArgs e)
 2 {
 3 	if (rr != null)
 4 	{
 5 		Plot pl=new Plot(rr,xBox,yBox,chart);
 6 	}
 7 	else
 8 	{
 9 		MessageBox.Show("Error, no data to plot! Please load csv file");
10 		return;
11 	}
12 }
Now we are ready to implement the constructor function of Plot. In short, we will get the index of the variable to plot from xBox and yBox and we will plot the corresponding columns:
1 public Plot(Read rr, ComboBox xBox,ComboBox yBox,Chart chart)
2 {
3 int indX = xBox.SelectedIndex;
4 int indY = yBox.SelectedIndex;
5 float[,] data = rr.get_Data();
6 int nLines = rr.get_nLines();
7
8 chart.Series.Clear(); //ensure that the chart is empty
9 chart.Series.Add("Series0");
10 chart.Series[0].ChartType = SeriesChartType.Line;
11 chart.Legends.Clear();
12 for (int j = 0; j < nLines; j++)
13 {
14 chart.Series[0].Points.AddXY(data[j,indX], data[j, indY]);
15 }
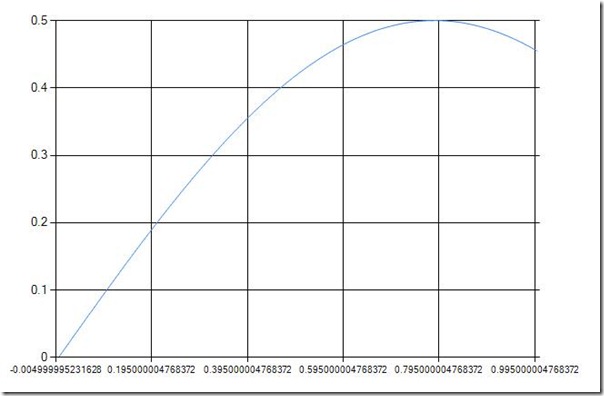
16 }We now have a working version of our application! For testing purposes I've created a simple input file: the first column is made by values from 0 to 1, the second column was obtained by applying the sinus to the first column an so on. Let's see our program in action:
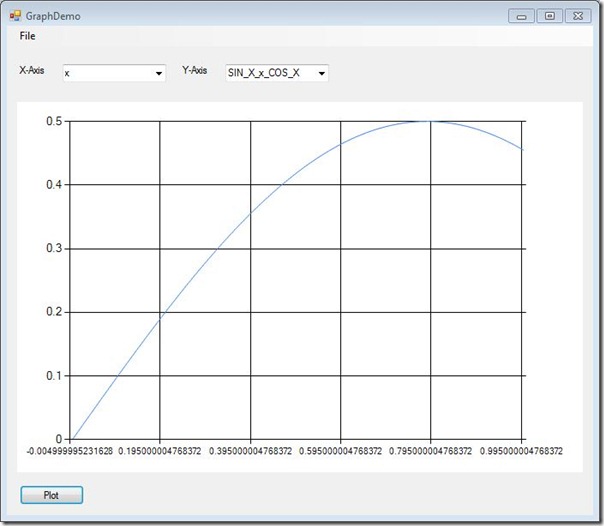
Obviously we still have work to do, e.g. we need to do something about the format of the numbers from the X axis, we could thicken a bit the blue line, add names on the axes and so on. We will work on fine tuning the aspect of the graph in the second part of this tutorial.
We still have to write the code for the Save submenu, for this double click Save in the Design panel and add this code in the newly created function:
 1 private void saveToolStripMenuItem_Click(object sender, EventArgs e)
 2 {
 3 	Stream myStream;
 4 	SaveFileDialog ff = new SaveFileDialog();
 5
 6 	ff.Filter = "jpg files (*.jpg)|*.jpg|All files (*.*)|*.*";
 7 	ff.FilterIndex = 1;
 8 	ff.RestoreDirectory = true;
 9
10 	if (ff.ShowDialog() == DialogResult.OK)
11 	{
12 		if ((myStream = ff.OpenFile()) != null)
13 		{
14 			using (myStream)
15 			{
16 				chart.SaveImage(myStream, System.Drawing.Imaging.ImageFormat.Jpeg);
17 			}
18 		}
19 	}
20 }
Next figure was obtained by using the Save menu:
Read the second part of this tutorial - Scientific graphics with C# part 2.